
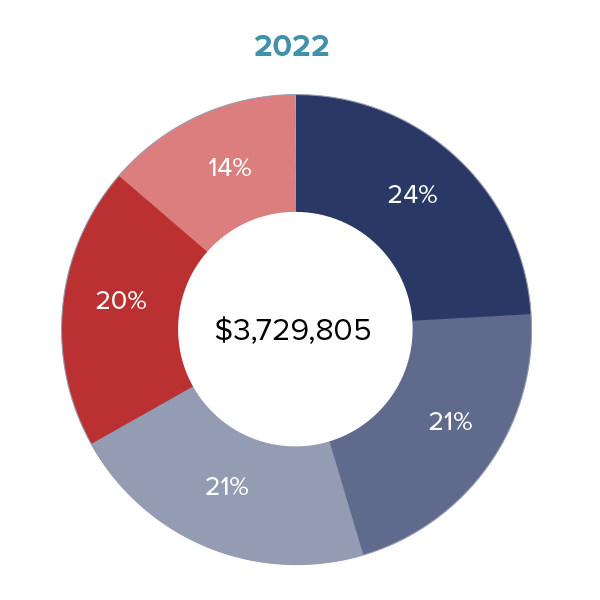
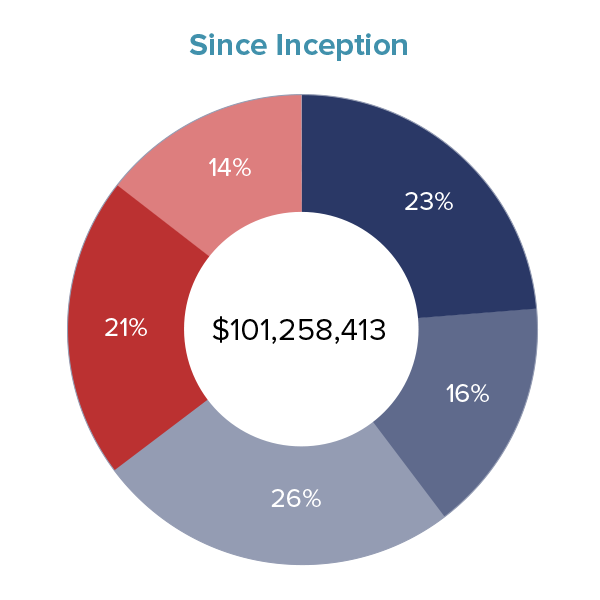
Grant Distribution

Statement of Financial Position
| Dec. 31, 2022 | Dec. 31, 2021 | ||
|---|---|---|---|
| Assets | |||
| Cash and Cash Equivalents | $ | 1,264,000 | 422,000 |
| Accounts Receivable and Other Assets | 826,000 | 2,351,000 | |
| Marketable Securities | 35,654,000 | 34,706,000 | |
| Real Estate | 71,000,000 | 71,000,000 | |
| Other | 16,798,000 | 16,371,000 | |
| Total Assets | 123,542,000 | 124,850,000 | |
| Liabilities and Net Assets | |||
| Accrued Liabilities and Other Payables | 5,000 | 1,000 | |
| Net Assets | 125,537,000 | 124,849,000 | |
| Total Liabilities and Net Assets | $ | 125,542,000 | 124,850,000 |
Statement of Activities
| Dec. 31, 2022 | Dec. 31, 2021 | ||
|---|---|---|---|
| Revenue, Gains (Losses) and Other Income | |||
| Interest | $ | 6,000 | 6,000 |
| Dividends | 2,281,000 | 2,470,000 | |
| Realized Gain (Loss) on Sale of Investments | (75,000) | 834,000 | |
| Income from Investment in Real Estate | 2,481,000 | 2,982,000 | |
| Unrealized Gain (Loss) on Investments | 261,000 | 19,579,000 | |
| Income (Loss) from Other | 804,000 | 4,498,000 | |
| Total Revenue, Gains (Losses) and Other Income | 5,758,000 | 30,369,000 | |
| Expenses and Grants Paid | |||
| Administrative and Federal Excise Tax | 1,340,000 | 1,134,000 | |
| Grants Paid | 3,730,000 | 4,161,000 | |
| Total Expenses and Grants Paid | 5,070,000 | 5,295,000 | |
| Increase (Decrease) in Net Assets | 688,000 | 25,074,000 | |
| Net Assets at the Beginning of the Year | 124,849,000 | 99,775,000 | |
| Net Assets at the End of the Year | $ | 125,537,000 | 124,849,000 |