
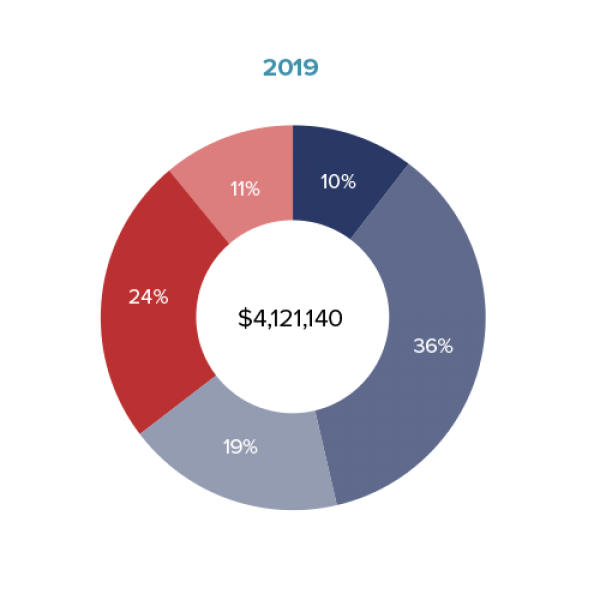
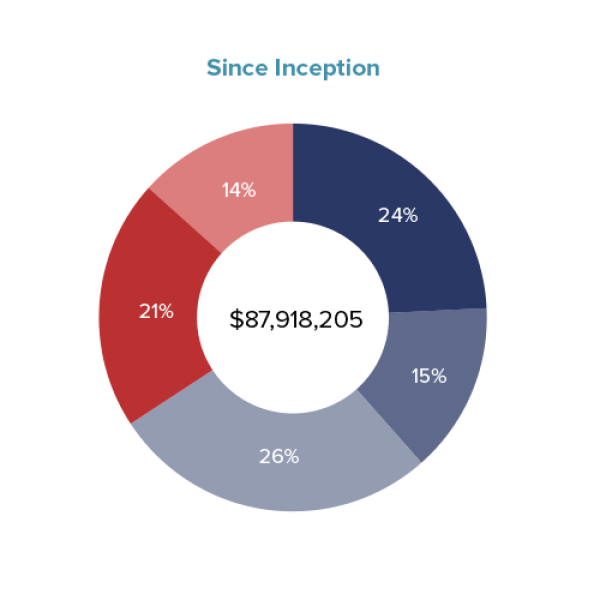
Grant Distribution

Statement of Financial Position
| Dec. 31, 2019 | Dec. 31, 2018 | ||
|---|---|---|---|
| Assets | |||
| Cash and Cash Equivalents | $ | 2,334,000 | 1,281,000 |
| Accounts Receivable and Other Assets | 1,602,000 | 887,000 | |
| Marketable Securities | 34,080,000 | 32,323,000 | |
| Real Estate | 56,258,000 | 55,742,000 | |
| Other | 7,103,000 | 7,752,000 | |
| Total Assets | 101,377,000 | 97,975,000 | |
| Liabilities and Net Assets | |||
| Accrued Liabilities and Other Payables | 80,000 | 0 | |
| Net Assets | 101,297,000 | 97,975,000 | |
| Total Liabilities and Net Assets | $ | 101,377,000 | 97,975,000 |
Statement of Activities
| Dec. 31, 2019 | Dec. 31, 2018 | ||
|---|---|---|---|
| Revenue, Gains (Losses) and Other Income | |||
| Interest | $ | 8,000 | 7,000 |
| Dividends | 2,096,000 | 2,158,000 | |
| Income from Investment in Real Estate | 3,204,000 | 2,322,000 | |
| Realized Gain (Loss) on Sale of Investments | 435,000 | 161,000 | |
| Unrealized Gain (Loss) on Investments | 2,470,000 | (6,152,000) | |
| Income (Loss) from Other | 294,000 | 191,000 | |
| Total Revenue, Gains (Losses) and Other Income | 8,507,000 | (1,313,000) | |
| Expenses and Grants Paid | |||
| Administrative and Federal Excise Tax | 1,064,000 | 913,000 | |
| Grants Paid | 4,121,000 | 4,071,000 | |
| Total Expenses and Grants Paid | 5,185,000 | 4,984,000 | |
| Increase (Decrease) in Net Assets | 3,322,000 | (6,297,000) | |
| Net Assets at the Beginning of the Year | 97,975,000 | 104,272,000 | |
| Net Assets at the End of the Year | $ | 101,297,000 | 97,975,000 |